01
De productlijnThe product line
Eén platform,
van desktop tot server
One platform,
from desktop to server
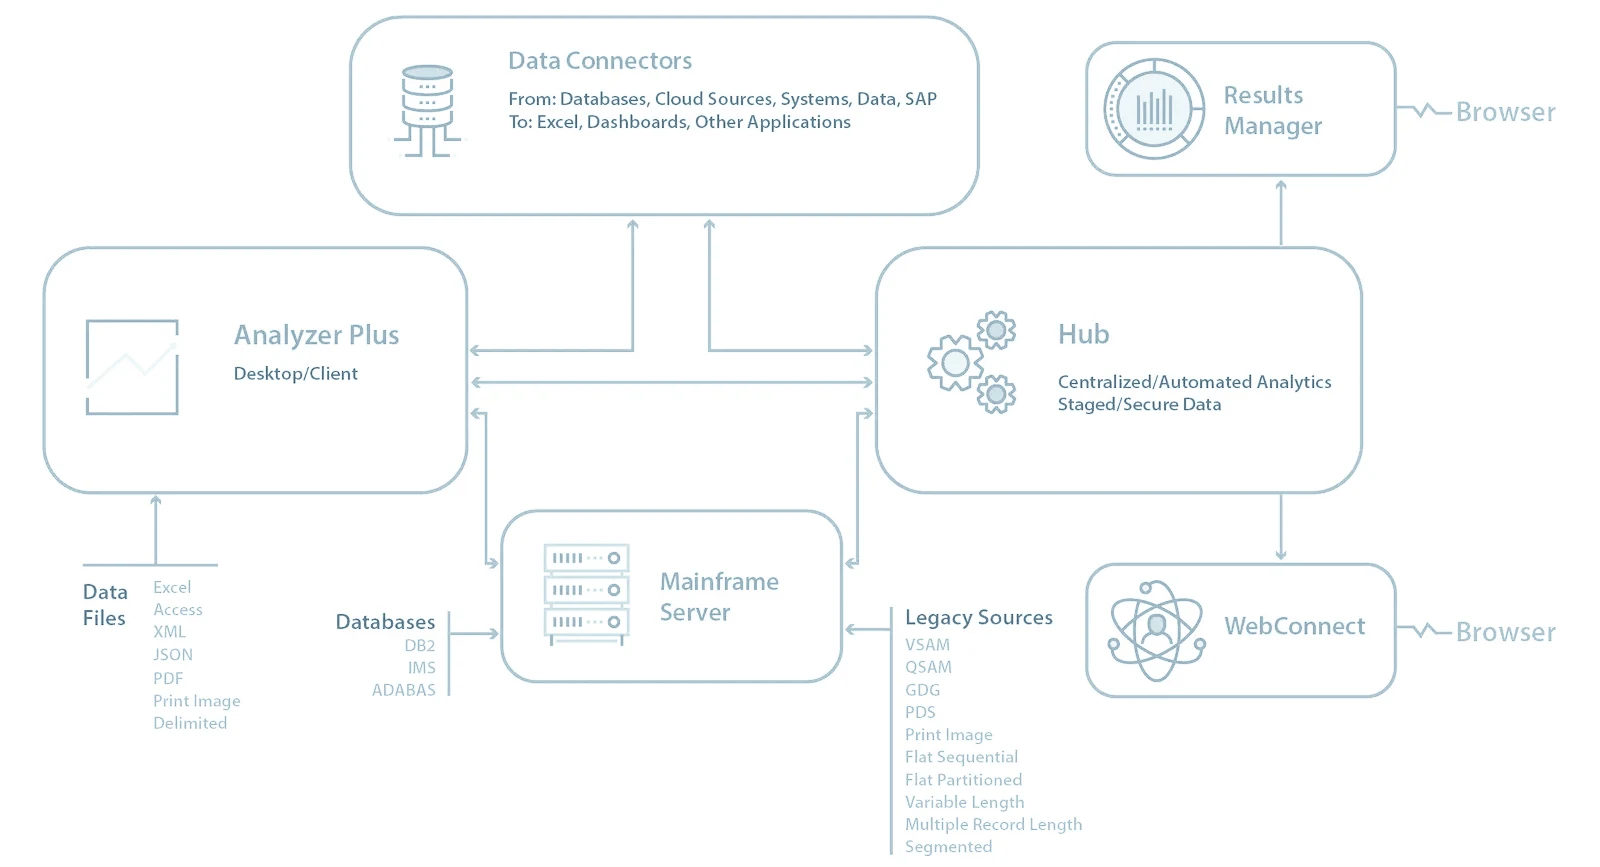
De productlijn van Arbutus bestaat uit acht onderdelen die op elkaar aansluiten: Analyzer op de desktop, Hub op de server en daaromheen de onderdelen voor resultaten, koppelingen, browsertoegang, standaardanalyses, datakwaliteit en mainframes.The Arbutus product line consists of eight parts that fit together: Analyzer on the desktop, Hub on the server and around them the parts for results, connections, browser access, standard analytics, data quality and mainframes.
Desktop · de kernDesktop · the core
Analyzer
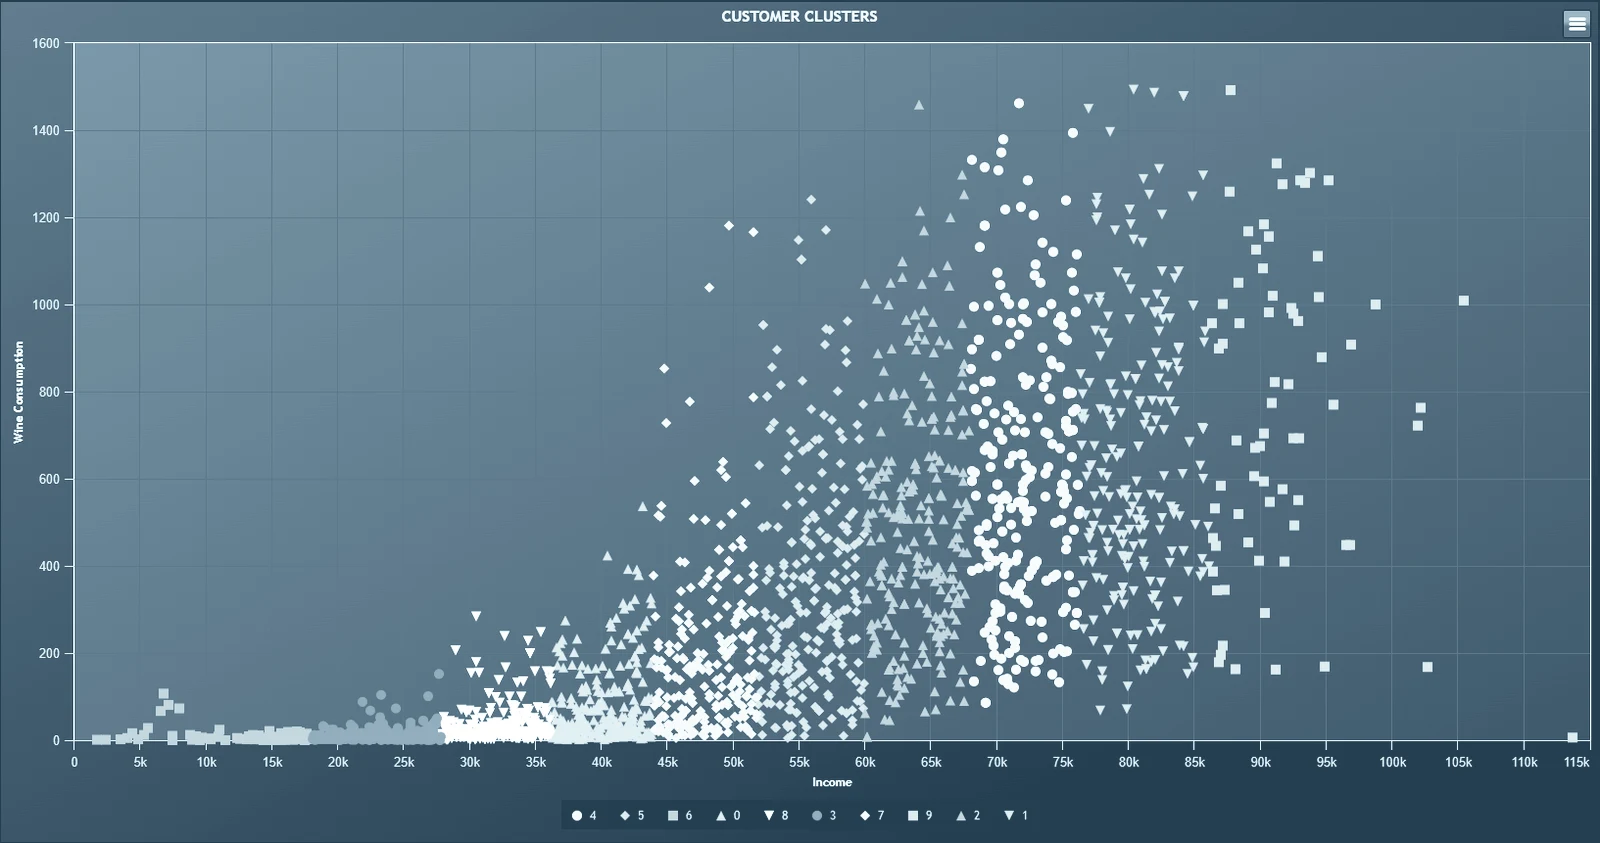
Krachtige analytics op je desktop, ontworpen voor analyse. Je stelt elke vraag aan al je data en verwerkt miljoenen records per seconde; met de ingebouwde visualisaties deel je bevindingen in de organisatie of je voedt er Power BI of Tableau mee.Powerful analytics on your desktop, engineered for analysis. You ask any question of all your data and process millions of records per second; with the built-in visualisations you share findings across the organisation, or you feed Power BI or Tableau.
- Alleen-lezen op de brondata en een opdrachtenlogboek dat elke handeling vastlegtRead-only on the source data and a command log that records every action
- Meer dan 200 kant-en-klare auditfuncties en opdrachten; geen limiet op bestandsgrootteOver 200 pre-built audit functions and commands; no file size limit
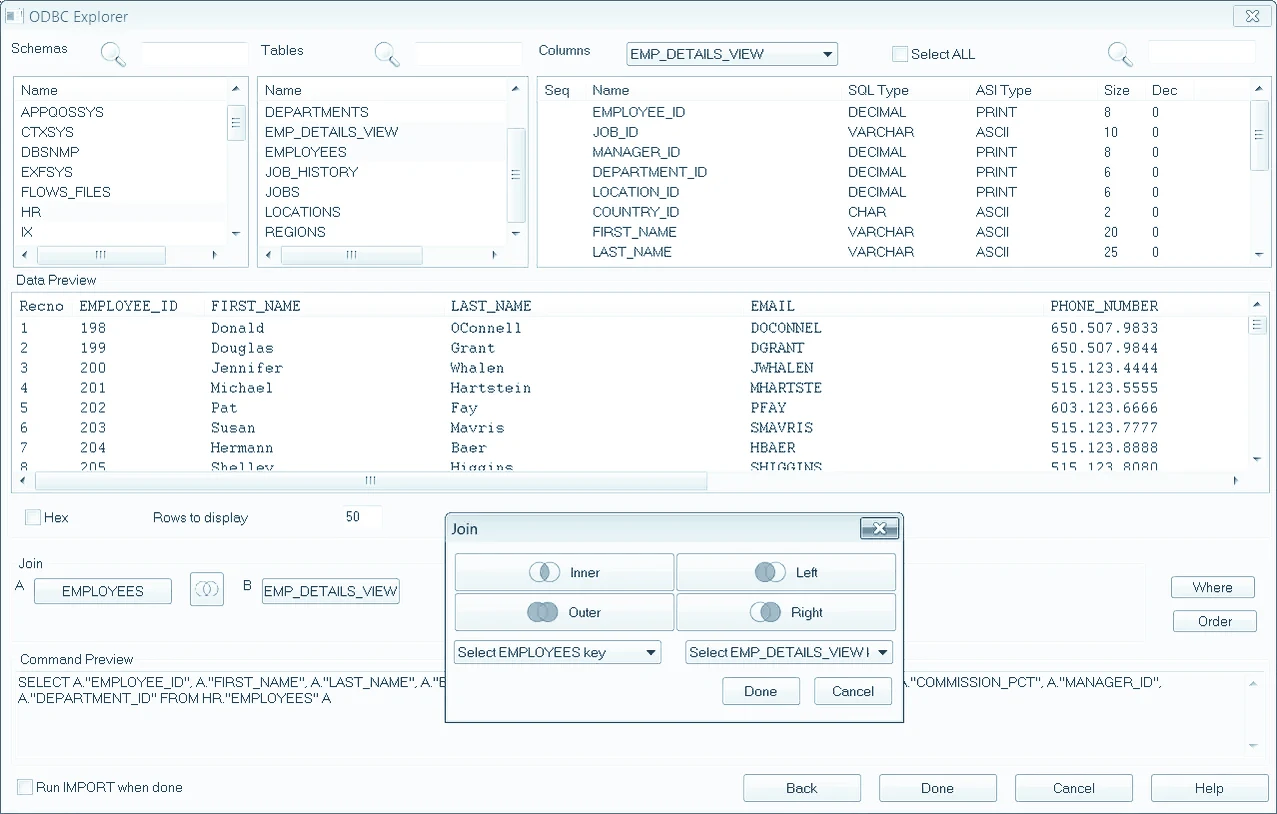
- Uiteenlopende data combineren, harmoniseren en herstructureren; import uit csv, Excel, Access, tekst, PDF, XML, AS400, Cobol-copybooks, dBase en ODBC-databasesCombine, harmonise and restructure disparate data; import from csv, Excel, Access, text, PDF, XML, AS400, Cobol copybooks, dBase and ODBC databases
- Open voor R, Python, SQL, Power BI, Tableau, PowerShell, Excel en ACL-projectenOpen to R, Python, SQL, Power BI, Tableau, PowerShell, Excel and ACL projects
Windows-serverWindows server
Hub
Plannen en automatiseren: analyses draaien op het moment dat het nodig is, buiten de piekuren of doorlopend, zonder handmatig ingrijpen. Alle data blijft op je eigen beveiligde servers achter je firewall, op locatie of in je eigen cloud.Schedule and automate: analytics run just in time, during off-peak hours or continuously, without manual intervention. All data stays on your own secure servers behind your firewall, on premise or in your own cloud.
- Meerdere threads en compressie; van desktop naar centrale serveranalyse in enkele klikkenMulti-threaded and compressed; from desktop to centralised server analytics in a few clicks
- Eenmalig aanmelden tussen Analyzer en Hub; uitvoerbestanden desgewenst versleuteldSingle sign-on between Analyzer and Hub; output files encrypted if desired
OpvolgingFollow-up
Results Manager
Een flexibele werkstroom om analyseresultaten te structureren, te prioriteren, toe te wijzen en op te volgen: visuele werkstromen, deadlines en budgetten, dashboards, meldingen in het systeem of per e-mail. Alle data versleuteld, in rust en onderweg.A flexible workflow to structure, prioritise, assign and follow up on analytics results: visual workflows, deadlines and budgets, dashboards, alerts in the system or by e-mail. All data encrypted, at rest and in motion.
Excel en Power BIExcel and Power BI
ConnectPlus
Brengt de analyses van Arbutus naar de toepassingen die mensen al kennen: data uit Arbutus-projecten en -tabellen laad je via ODBC rechtstreeks in Excel, Power BI, Access en andere ODBC-toepassingen, ververst en opnieuw te gebruiken.Brings Arbutus analytics into the applications people already know: data from Arbutus projects and tables loads through ODBC straight into Excel, Power BI, Access and other ODBC applications, refreshed and reused.
BrowserBrowser
WebConnect
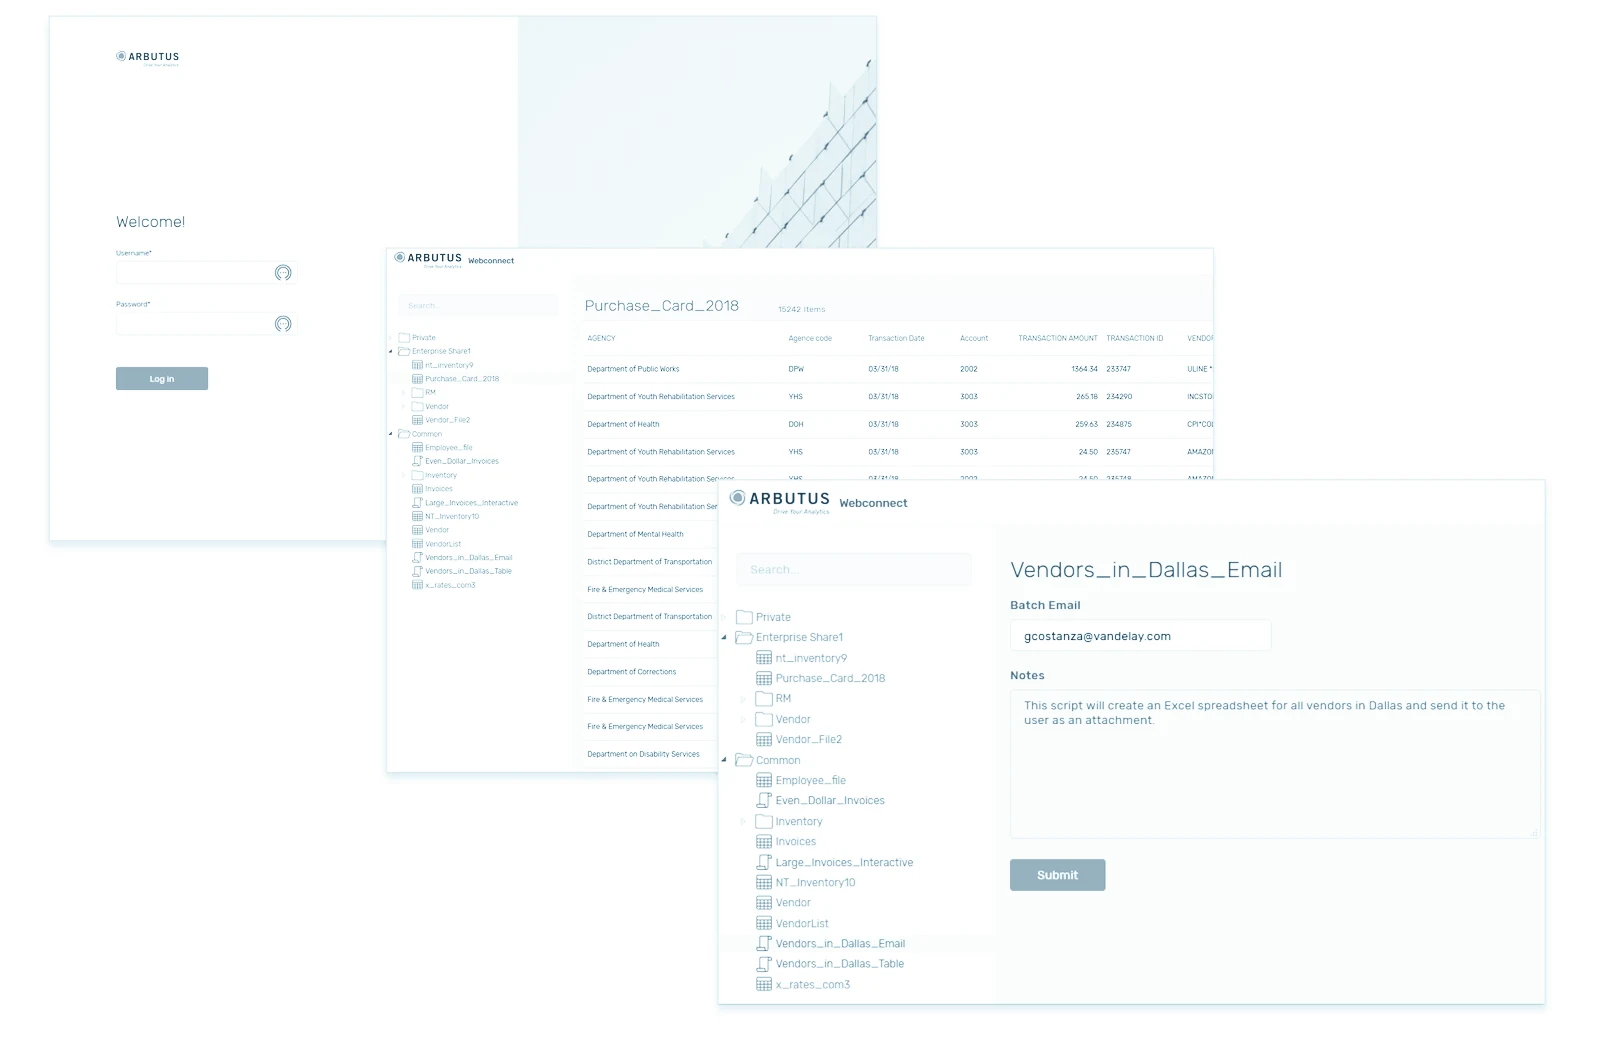
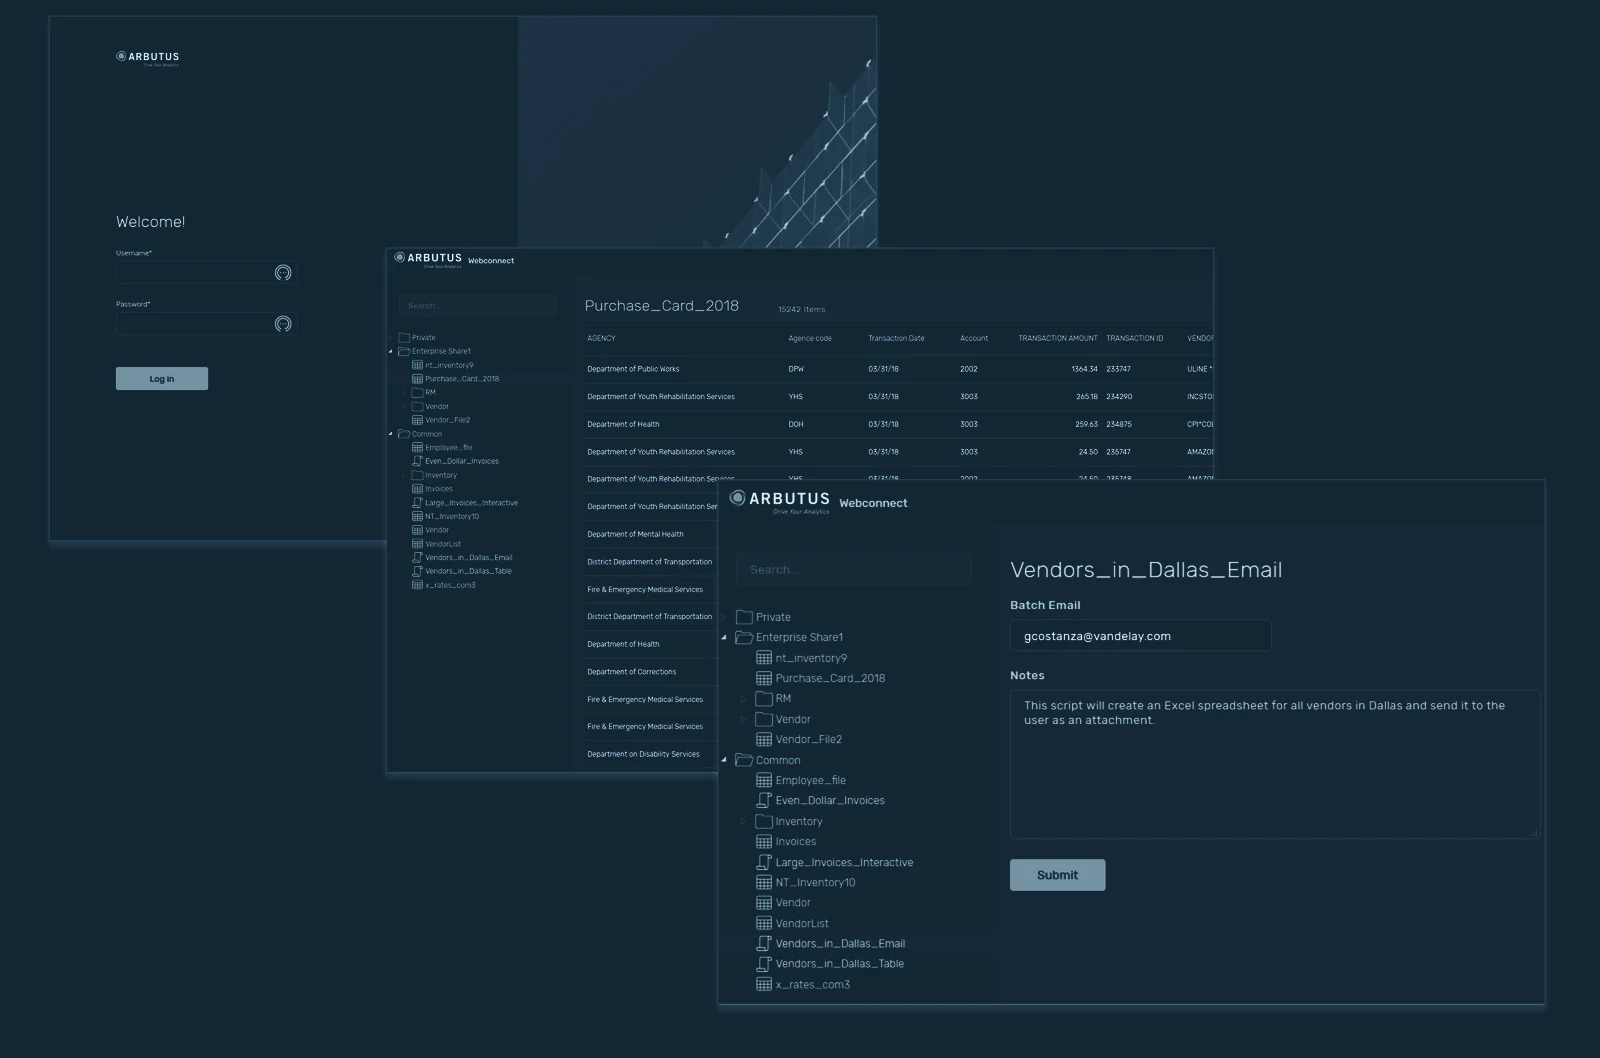
Toegang tot data, resultaten en toepassingen vanuit elke browser op telefoon, tablet of pc, zodat ieder teamlid meedoet, ongeacht technisch niveau of locatie. Resultaten exporteer je naar Excel vanuit de browser.Access to data, results and apps from any browser on phone, tablet or PC, so every team member joins in, whatever their technical level or location. Results export to Excel from the browser.
StandaardanalysesStandard analytics
SmartApps
Kant-en-klare procedures die met de installatie meekomen en veelgebruikte auditanalyses uitvoeren voor crediteuren, debiteuren, vaste activa, fraude en compliance, grootboek, voorraad en personeel. Voorbeelden: dubbele facturen of betalingen, transacties in risicolanden, journaalposten per gebruiker.Ready-made procedures that ship with the installation and run widely used audit analytics for accounts payable, accounts receivable, fixed assets, fraud and compliance, general ledger, inventory and human resources. Examples: duplicate invoices or payments, transactions in high-risk countries, journal entries by user.
Datakwaliteit en mainframeData quality and mainframe
DQM & Mainframe Server
Met DQM, onderdeel van Hub, maak je datakwaliteitstests zonder programmeren en laat je ze draaien van eens per minuut tot eens per kwartaal, met bevindingen die desgewenst een herstelproces in Results Manager kunnen starten. De Mainframe Server geeft rechtstreekse toegang tot DB2, IMS, ADABAS, VSAM, ISAM en QSAM op z/OS, OS/390 en MVS, met een voetafdruk van minder dan 5 MB.With DQM, part of Hub, you create data quality tests without coding and run them from once a minute to once a quarter, with findings that can, if desired, trigger a remediation process in Results Manager. The Mainframe Server gives direct access to DB2, IMS, ADABAS, VSAM, ISAM and QSAM on z/OS, OS/390 and MVS, with a footprint of less than 5 MB.